Insurance closed Hormuz before Iran did
Marine insurers withdrew cover within 48 hours of the February 2026 strikes, and traffic collapsed before a single mine was laid. In the Red Sea, attacks fell 95% and the ships never came back. The premium is the chokepoint.
- Horizon
- Immediate · 2026–2027
- Signal strength
- High on transit and cover withdrawal · Medium on reopening hysteresis
- Decision lens
- Shipping · Energy · Insurance · Food security
- Reading time
- 9 minutes
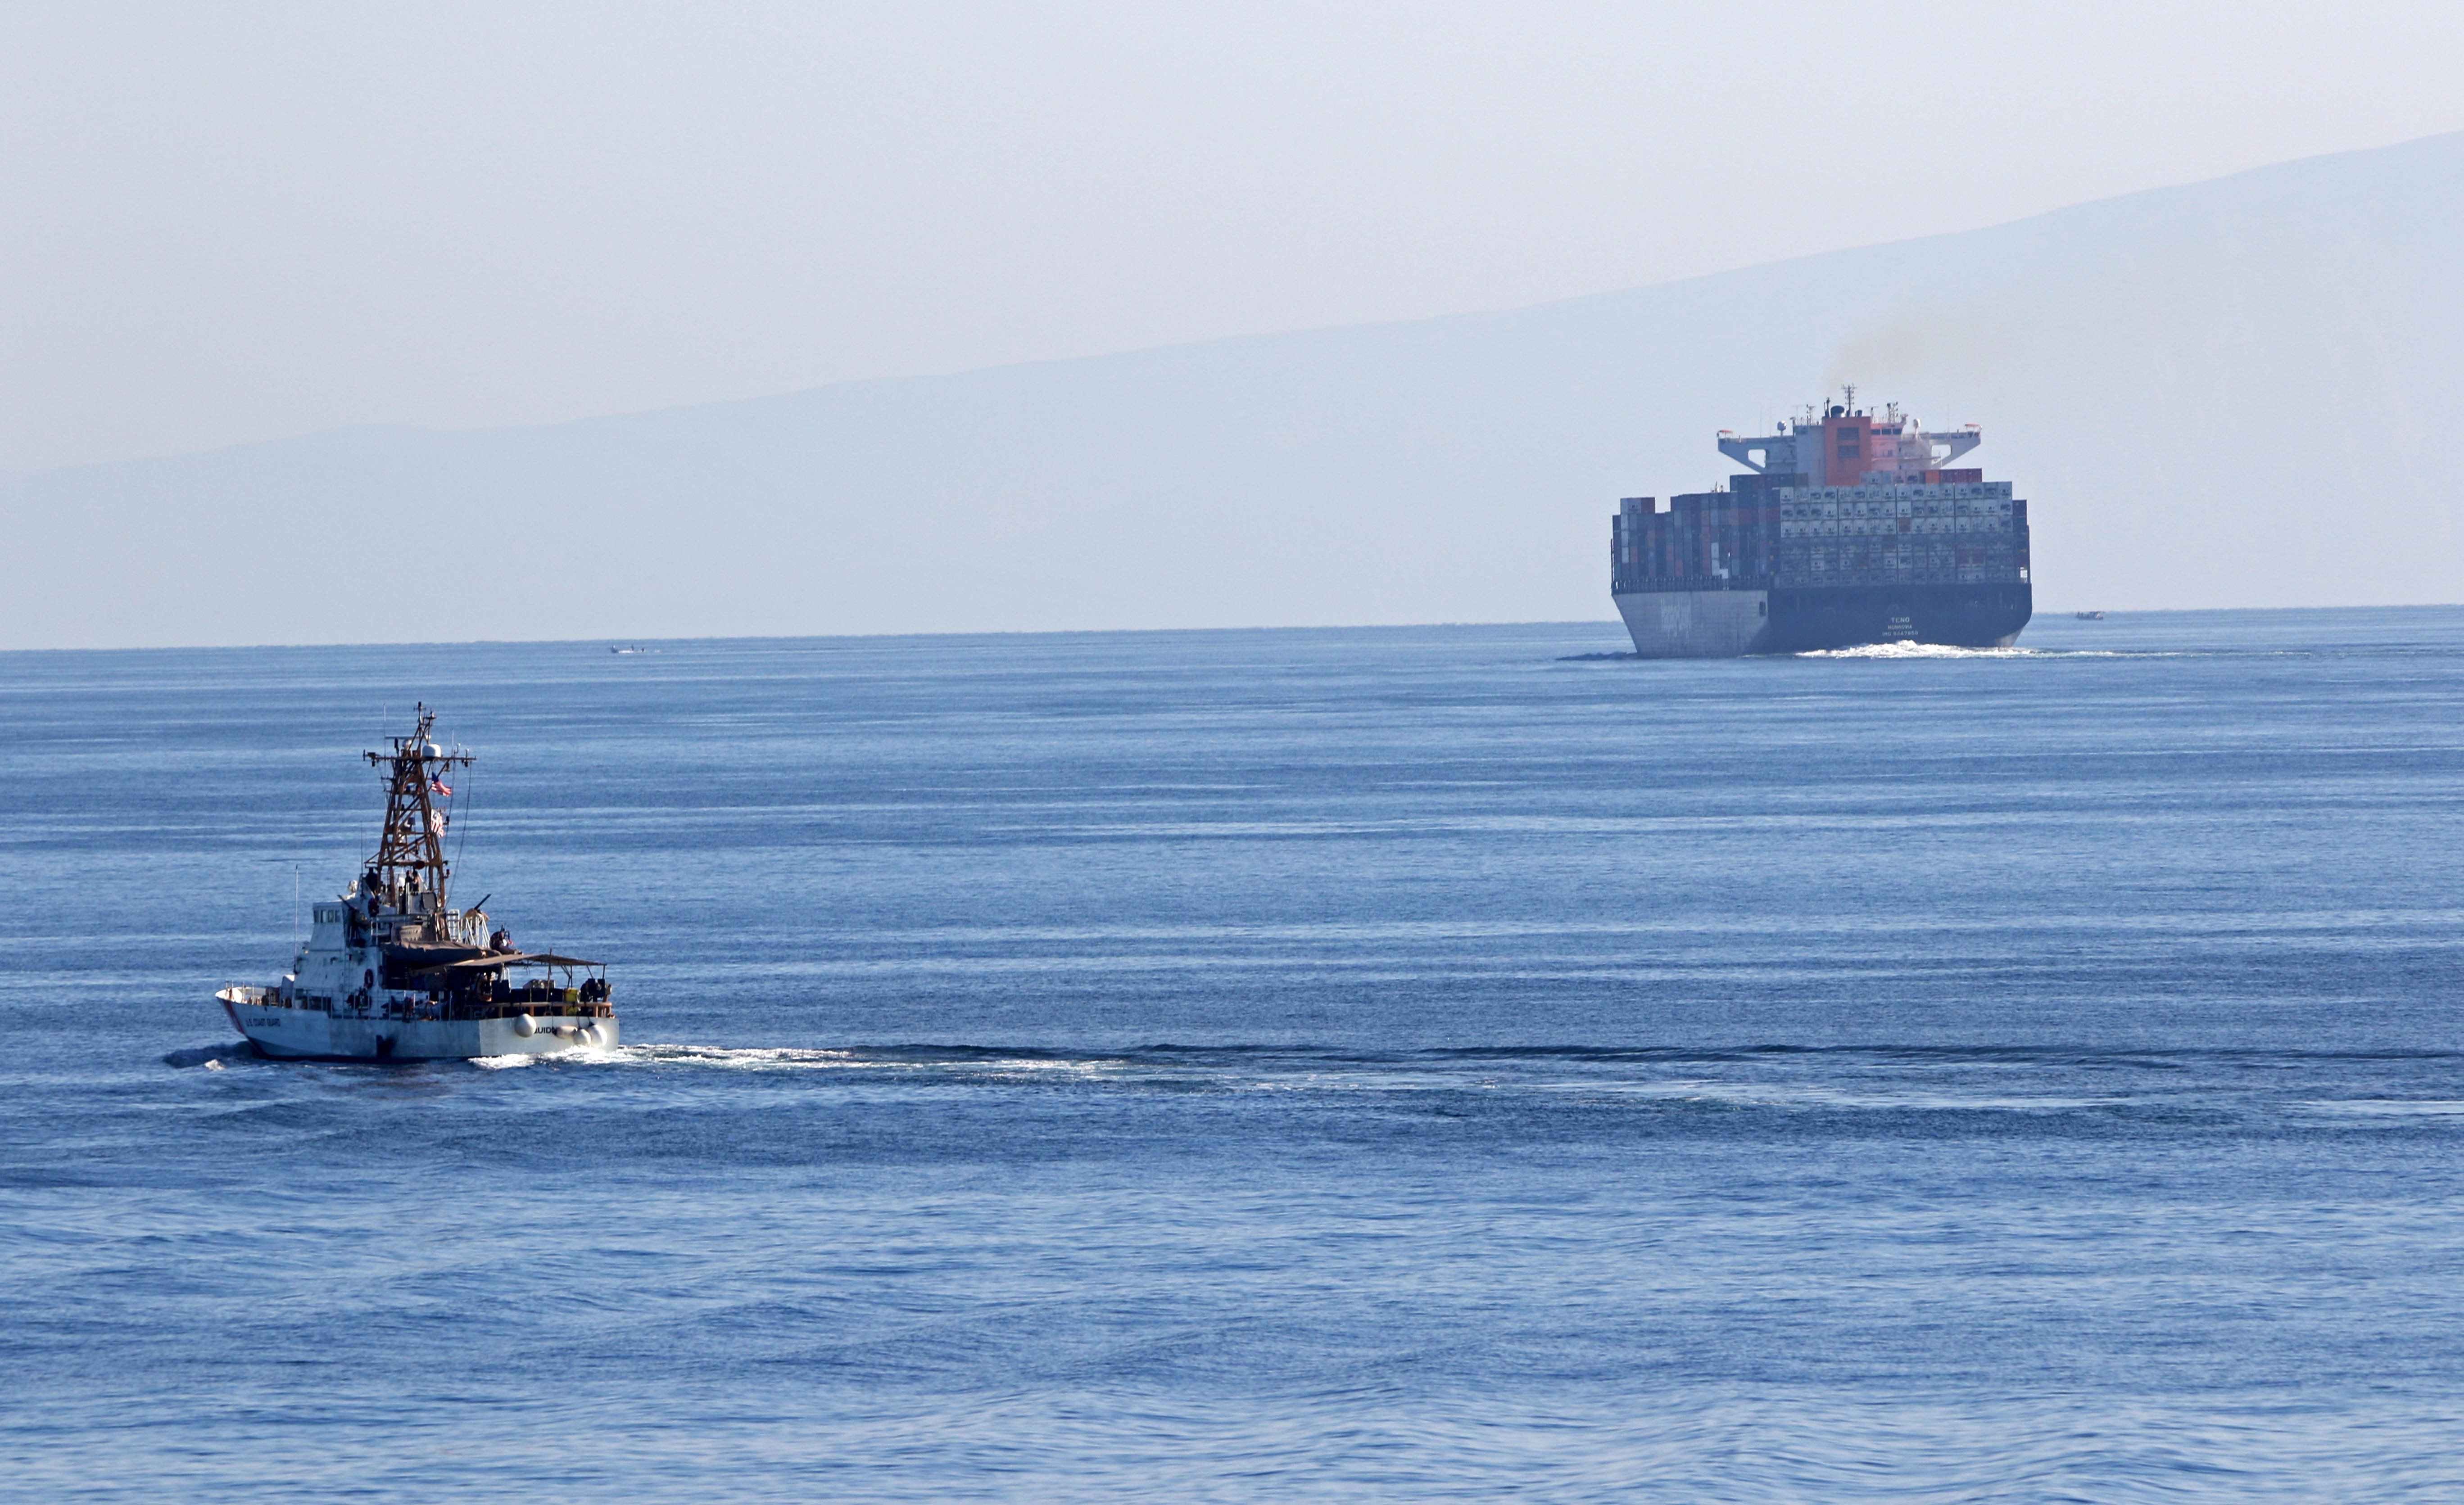
A maritime chokepoint can close commercially before it closes physically because insurance capacity is a precondition for sailing, not merely another voyage cost.
After the February 2026 strikes, war-risk premiums surged and major insurers withdrew cover before mines and vessel attacks arrived. Traffic fell first on an underwriting decision: without war cover, charterers, lenders and flag states will not permit the voyage even when the channel remains navigable.
The Red Sea suggests the effect reverses slowly. Attacks fell sharply, yet traffic stayed depressed because carriers had rebuilt networks around the Cape route and insurers still priced the possibility of renewed disruption. For exposed cargoes, the leading indicator is therefore insurance availability and premium structure rather than incident counts alone.
Public evidence brief5 cited findings behind the assessment
Question answered
What actually closes a maritime chokepoint?
This evidence layer is public and citable. The complete analysis, rankings, calculations, scenarios, and decision implications continue below.- Geography
- Strait of Hormuz · Red Sea · Persian Gulf · Gulf of Oman
- Sectors
- Shipping · Marine insurance · Oil and gas · Fertiliser
- Risk classes
- Chokepoint risk · Insurance withdrawal · Network hysteresis · Supply interruption
- Potential impact
- Rapid commercial closure of a still-navigable waterway, followed by persistent disruption to oil, LNG, fertiliser and industrial-material flows even after kinetic risk falls
- Time horizon
- Immediate · 2026–2027
Key findings and source trail
The evidence an outside reader can verify.
- 01
Hormuz is a systemically concentrated energy passage with limited physical bypass capacity.
The US EIA estimates roughly 20 million barrels per day moved through Hormuz in 2024, about one fifth of global petroleum liquids consumption.
- 02
LNG exposure is even less substitutable than oil exposure.
The EIA reports that Qatar and the UAE depend heavily on Hormuz for LNG exports and that the route carried about 19% of global LNG trade.
- 03
Insurance-market classification can change the commercial status of the entire Gulf at once.
The Lloyd's Joint War Committee maintains the listed-area framework used by marine insurers to identify elevated war-risk zones.
- 04
Withdrawal of cover is categorically different from a higher premium.
The International Group of P&I Clubs represents insurers covering most oceangoing tonnage; cancellation of war cover removes the financial permission to sail rather than merely raising voyage cost.
- 05
Traffic can stay diverted after attacks fall because the network has already been rebuilt around a longer route.
Drewry's reporting tracks the persistent diversion of container services from Suez and the Red Sea, supporting the distinction between lower incident frequency and restored commercial confidence.
Risk transmission
How the exposure reaches the decision.
- 01
Regional strikes cause underwriters to reprice or withdraw war-risk capacity.
- 02
Charterers, financiers and flag states refuse uninsured voyages.
- 03
Carriers divert and rebuild services around longer routes.
- 04
Energy, fertiliser and industrial cargoes lose effective market access.
- 05
Traffic remains depressed until insurers and network planners regain confidence, which can lag the fall in attacks.
Entities and topics
- Lloyd's Joint War Committee
- International Group of P&I Clubs
- QatarEnergy
- Saudi Aramco
- Drewry
The Strait of Hormuz did not close because Iran mined it. It closed because insurers stopped writing cover.
Within 48 hours of the US and Israeli strikes on 28 February 2026, war-risk premiums rose fivefold. Major marine insurers cancelled existing policies and offered replacements at roughly sixty times pre-crisis rates. Lloyd's Joint War Committee redesignated the entire Arabian Gulf a conflict zone. Tanker traffic collapsed by more than 80%.
The mines came later. So did the strikes on vessels. The physical blockade, the thing every chokepoint model is built to anticipate, arrived after the waterway had already emptied.
The commercial shutdown preceded the physical one, and that ordering is the whole finding. Most chokepoint analysis is watching the wrong variable. Analysts count incidents, track naval movements and model mine-laying capacity, while the market had already answered the question days earlier using a different instrument.
If you want to know whether a chokepoint is about to close, the most informative number is not how many ships have been attacked. It is what it costs to insure the next one.
1. What happened
Hormuz normally carries around 20 million barrels a day, roughly a quarter of world seaborne oil trade and about 20% of global petroleum liquids consumption. It is the most concentrated energy passage on earth.
Per the shipping and insurance reporting, about 90% of traffic diverted immediately after the strikes. When Iran threatened to attack shipping days later, diversion rose above 95%.
By early May the collapse was close to total. Against a historical average of about 138 vessel transits a day, Hormuz saw 6 transits on 3 May and 5 on 4 May, declines of 95.7% and 96.4%.
Kinetic escalation followed and compounded it. At least eight vessels were struck, Ras Tanura and Fujairah were hit, and mines were eventually laid. None of that started the collapse. All of it arrived at a waterway commercial shipping had already abandoned on a purely financial calculation.
2. The premium moved first, and it moved further than the ships did
War-risk cover for Hormuz has a published price path, and read as a time series rather than a cost line it works as an early-warning indicator.
Per the insurance reporting, baseline was about 0.125% of hull value. It drifted to 0.2–0.5% through mid-2025 as regional tension built, reached 1–3% in the run-up to the war, and touched 7.5–10% at the acute peak.
That top of the band is 80 times baseline, which makes the widely reported sixty-fold replacement quotes entirely consistent rather than the hyperbole they were often taken for. The market was not panicking. It was repricing accurately and very fast.
Then something more consequential than any price move happened. The capacity itself withdrew.
All twelve members of the International Group of P&I Clubs, between them covering 90% of the world's oceangoing tonnage, cancelled certain war cover on 72 hours' notice.
That distinction matters more than any premium figure here. A ship without war cover does not sail. Not because the master judges the risk too high, but because the charterer will not load it, the financier will not permit it and the flag state will not clear it. Insurance is not a cost of doing business in shipping. It is a precondition for the cargo being on the vessel at all.
The decision moves from the bridge to the underwriter. Underwriters reprice in hours on information that changes daily, whereas physical risk assessments move over weeks. That difference in clock speed is why the insurance market leads and the incident count lags.
3. The Red Sea is the control experiment
Here is the test that separates a real finding from a plausible story. If insurance simply tracked danger, traffic should recover when danger recedes. The Red Sea gives a clean case, and it shows the opposite.
Houthi attacks peaked at 150 in 2024 and fell to 7 in 2025 after ceasefires, a decline of 95.3%. The threat all but disappeared. Suez container traffic was still down about 75% against pre-crisis levels as of mid-2025, and had not recovered by early 2026.
The threat fell by nineteen twentieths. The trade did not come back.
That is not market irrationality, and the reason matters because it is what makes the effect durable. Rerouting via the Cape of Good Hope costs roughly 10 to 14 extra days and about $1 million per voyage in fuel, crew and insurance, stretching Asia to Europe transit from around 35 days to 49 at the peak.
A carrier facing that cost does not simply absorb it. It rebuilds the network around the long route, rescheduling port calls, redeploying vessels, renegotiating service contracts and repositioning empty containers. Once that rebuild is done, going back is another expensive reorganisation, and it will not be undertaken on the strength of a quiet quarter. It needs confidence that quiet will hold, and confidence about future quiet is precisely what an insurer prices.
Our read, not a sourced finding: chokepoint risk is hysteretic. It goes up faster than it comes down, and the asymmetry lives in insurance and network planning rather than in the threat itself.
4. What has nowhere else to go
A premium spike bites at Hormuz rather than simply raising costs because the alternatives barely exist.
Per EIA and Aramco statements, pipeline bypass capacity runs 3.5–5.5 million barrels a day against a 20 million barrel flow, between 17.5% and 27.5% of it. Turn that around and you get the number that should anchor any Hormuz analysis: roughly 72.5% of the oil moving through the strait has no overland option at all.
The headline bypass figures are softer than they look, too. Saudi Arabia's East-West line is rated at 7 mb/d, but Aramco stated in March 2026 that only about 5 mb/d could actually be freed for export, the rest feeding domestic refineries that cannot simply be switched off. Iran built the Jask terminal precisely as a bypass for its own crude, and it is effectively non-operational.
For gas the position is not partial but absolute. Per EIA, about 93% of Qatar's LNG exports and 96% of the UAE's transited Hormuz in 2025, some 19% of global LNG trade, with no alternative route to market of any kind. LNG moves as a cryogenic liquid in purpose-built vessels. There is no pipeline equivalent, which is why Qatar's exposure is structural rather than logistical and why no amount of capital changes it.
The cargo list is also much wider than energy, which is where most analysis stops short. Per EIA, more than 30% of global urea trade, about 20% of ammonia and phosphate, roughly 8% of aluminium supply and around half of seaborne sulphur are tied to Hormuz flows.
So a fertiliser shock is a live second-order consequence of an oil chokepoint. It is almost never modelled as one, and it moves through a slower channel than the food-security route people do model, because fertiliser reaches food prices through the next planting cycle rather than the next grain shipment.
5. What this changes
Watch the premium, not the incident count. War-risk rates moved before traffic did in 2026 and stayed elevated after attacks collapsed in the Red Sea. As a leading indicator they beat casualty counts in both directions, which is unusual, because most indicators are good in one direction only.
Treat withdrawal of capacity as a different event from repricing. This is the most useful distinction here. A sixty-times quote is a cost problem, and a high enough freight rate absorbs it. Painful, but the trade continues. Twelve P&I clubs cancelling on 72 hours' notice is not a price at all. It is the absence of a market, and no freight rate clears it. The first is an expensive quarter. The second is a closed waterway.
Do not assume symmetry. The Red Sea data is the clearest evidence available that a corridor can become safe again without becoming busy again. Anyone modelling a Hormuz reopening as the mirror image of its closure is assuming something the most recent comparable case directly disproves.
Give second-order cargo first-order attention. Urea, ammonia, phosphate and sulphur move through the same water as the crude, and a food-security consequence arriving through fertiliser is slower to appear and harder to reverse than one arriving through grain, because it lands on a harvest rather than on a shipment.
One caution, because it cuts against the argument. Car-carrier rates fell from $105,000–115,000 a day in 2023–24 to about $45,000 by early 2026, a decline of 60.9%, while disruption was actively worsening. That was supply rather than safety: the fleet expanded more than 40%, with 75 new vessels delivered in 2024 alone.
So freight rates are not a clean risk proxy. They carry vessel supply, fuel cost and route length mixed together. Insurance is closer to a pure signal because it prices one thing. It is still not clean, and anyone using it should know what else is in it.
Sources
- authoritative · US EIA — Strait of Hormuz transit volumes — ~20 million b/d in 2024; ~20% of global petroleum liquids consumption; producer and destination shares
- authoritative · US EIA — Hormuz and LNG transit — Qatar and UAE LNG dependence; 19% of global LNG trade
- researched · Lloyd's Joint War Committee — listed areas — the Arabian Gulf conflict-zone redesignation
- researched · International Group of P&I Clubs — war-cover cancellation on 72 hours' notice across all twelve clubs, ~90% of oceangoing tonnage
- researched · Reuters — Hormuz shipping and war-risk premiums, 2026 — the fivefold surge, ~60× replacement quotes, traffic collapse and transit counts. ⚠ premium bands are market quotations, not a published index; treat the 0.125%–10% path as indicative
- researched · Clarksons / Drewry — Red Sea and Suez traffic — Suez container traffic ~75% below pre-crisis; Cape diversion cost and transit-time impact
- scaffold · In-session arithmetic — the 80× premium ratio, the −95.7%/−96.4% transit falls, the −95.3% attack decline, the 17.5–27.5% bypass adequacy and its 72.5% complement, and the −60.9% car-carrier move. ⚠ not an external source; the hysteresis reading in §3 and the fertiliser-transmission emphasis in §4 are ours, not any source's
Continue the thread
Get the next material change, not the next headline.
Receive new UFOQ briefings and concise signal updates when the evidence changes enough to matter.