The copper shortage will be paid for by beer cans
Copper's safety valve is substitution into aluminium. It just opened at a record price ratio — into a metal with 0.06 days of free float and 8% of world smelting bombed. The bill lands on industries that never bought copper.
- Horizon
- Immediate · 2026–2030
- Signal strength
- High on inventories and outages · Medium on substitution volume
- Decision lens
- Power grids · Data centres · Automotive · Packaging
- Reading time
- 12 minutes
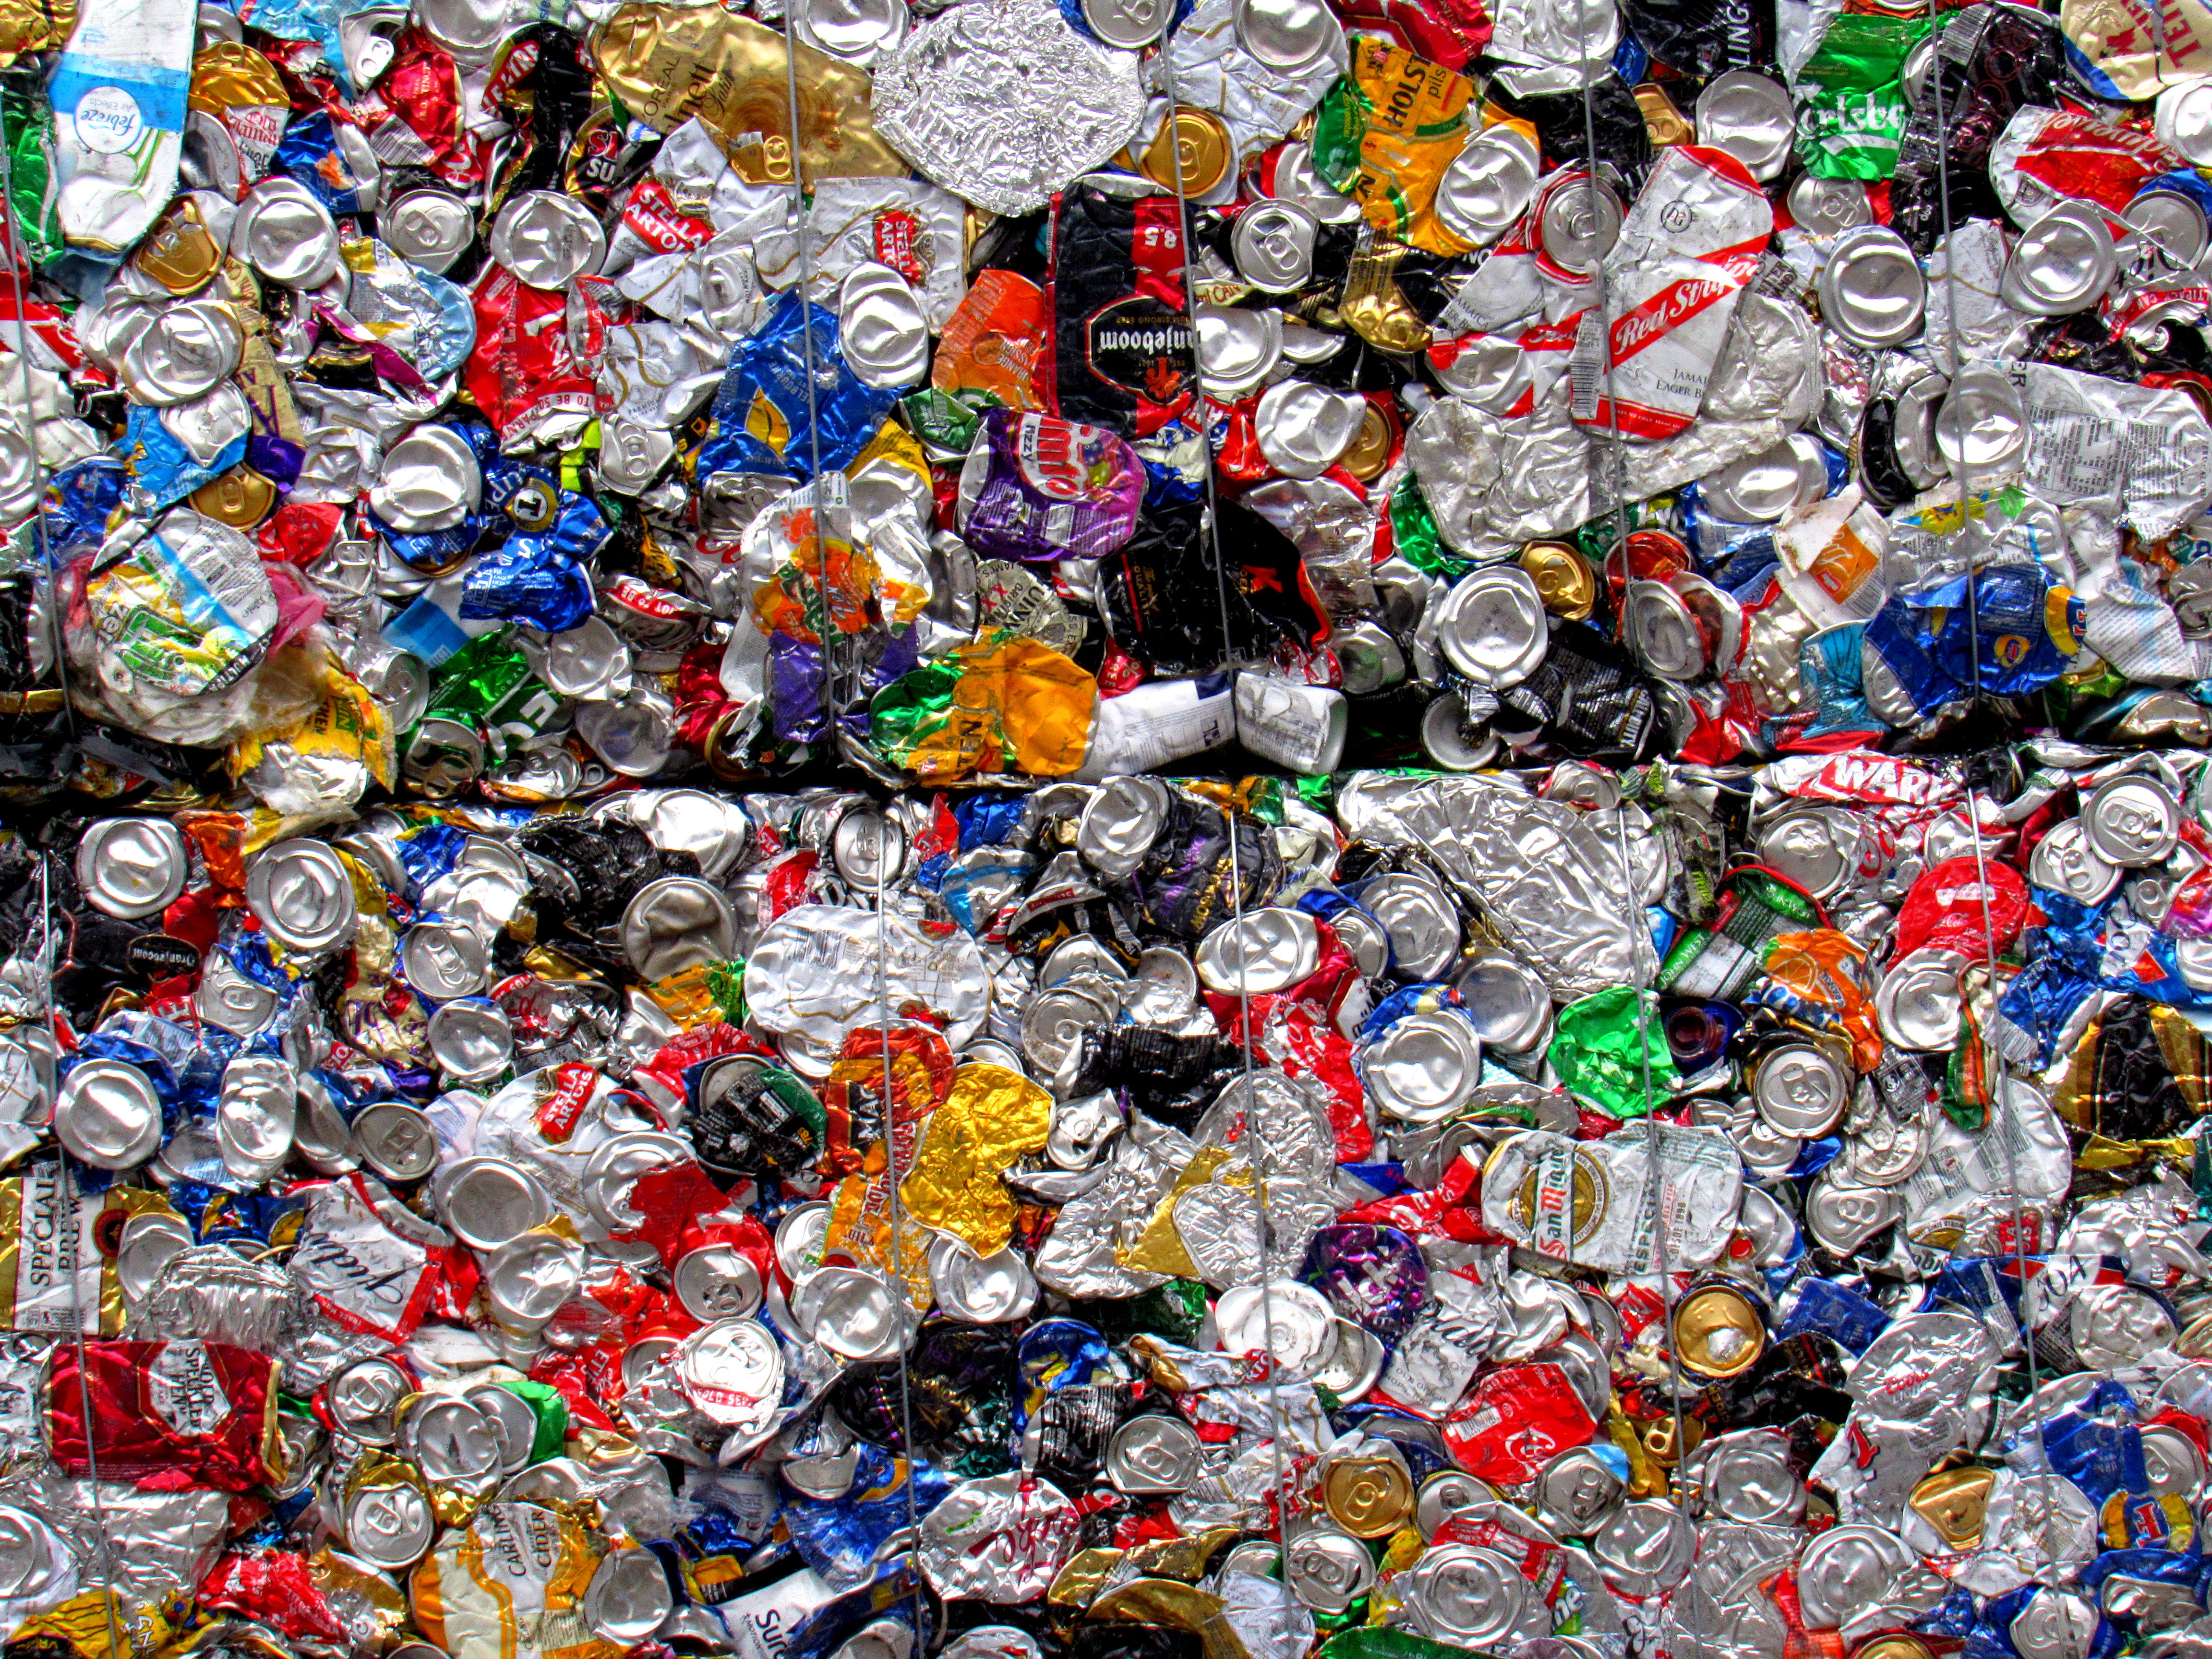
Copper substitution does not eliminate scarcity; it transfers demand into aluminium and passes the cost to industries that had no copper exposure.
The copper-to-aluminium price ratio has moved beyond the range where substitution becomes attractive, but accessible aluminium inventories are exceptionally thin and China is operating at its administrative production ceiling. The normal safety valve therefore empties into a market with little immediately available metal.
Gulf smelter outages intensify the constraint and spread it across grids, data centres, solar, vehicles, construction and packaging. The relevant signal is the physical aluminium premium rather than the exchange price alone, while scrap—especially the beverage-can loop—is the fastest source of genuine supply response.
Public evidence brief5 cited findings behind the assessment
Question answered
Who actually pays when copper users switch to aluminium?
This evidence layer is public and citable. The complete analysis, rankings, calculations, scenarios, and decision implications continue below.- Geography
- China · Gulf · United States · Global
- Sectors
- Power grids · Data centres · Automotive · Solar · Construction · Packaging
- Risk classes
- Cross-commodity substitution · Inventory risk · Smelter outage · Physical-premium shock
- Potential impact
- Higher input costs and delivery delays across electricity infrastructure, data centres, vehicles, solar modules and packaging, with the largest surprise borne by aluminium users that never modelled copper risk
- Time horizon
- Immediate · 2026–2030
Key findings and source trail
The evidence an outside reader can verify.
- 01
Copper supply growth is slow enough to keep substitution economically relevant.
USGS data show limited mine-supply growth and a much larger Chinese share of refining than mining, leaving both volume and processing concentration exposed.
- 02
The aluminium swing supplier is constrained by policy as well as economics.
USGS places China at more than 60% of world aluminium output and at its stated 45 million-tonne capacity ceiling.
- 03
Copper-to-aluminium substitution is directionally credible but the precise volume is forecast-dependent.
J.P. Morgan's path cited in the research moves substitution from roughly 2% of copper demand toward 6% by 2030; it is one forecast rather than an observed elasticity.
- 04
Exchange inventory overstates the metal available to many Western buyers.
LME warehouse data cited in the article show historically low stocks dominated by Russian material, making warrant composition as important as the headline tonnage.
- 05
Notice period can determine whether a continuous-process outage lasts weeks or a year.
Operator reporting distinguishes Qatalum's warned, controlled shutdown from abrupt damage at Alba and EGA, where frozen smelting cells create a much longer restart path.
Risk transmission
How the exposure reaches the decision.
- 01
Copper becomes expensive enough for technically flexible users to redesign into aluminium.
- 02
Incremental demand enters an aluminium market with very little accessible exchange stock.
- 03
China cannot provide its usual swing response and Gulf smelter outages remove additional capacity.
- 04
Urgent grid and data-centre buyers bid up physical metal and delivery slots.
- 05
Packaging, construction, solar and automotive users absorb a cost created outside their own demand system.
Entities and topics
- EGA
- Alba
- Qatalum
- London Metal Exchange
- J.P. Morgan
- USGS
A beverage can has no copper in it. The company that makes it has no copper exposure, no copper hedge, and no reason to read a copper report.
It is about to pay for a copper shortage anyway.
Here is how. Copper has always had a safety valve: when it gets expensive enough, engineers switch to aluminium. Thicker cable, same current, lower bill. That valve is why copper squeezes have never run away.
The valve just opened. The copper-to-aluminium price ratio hit a record 4.3 against a 3.7 long-run average, past the 3.5–4.0 band where switching pays for itself.
And it discharges into a metal that has nothing spare. Aluminium's usable exchange stock is 0.06 days of world production. The one producer able to respond is sitting at exactly 100.0% of its own legal ceiling. And 8.03% of world smelting capacity sits inside the Strait of Hormuz, where two of the largest plants outside China and Russia were hit by missiles in March.
So the pressure does not stop at the substitution boundary. It crosses into aluminium, and then it keeps going: into packaging, into solar, into car bodies, into everything that competes for the same metal and never had a copper problem in the first place.
That is the risk this article is about. Not copper's price. The bill copper hands to industries that never bought any.
1. Why the valve exists, and why it just opened
Copper is the best affordable electrical conductor there is. Aluminium runs at about 61% of its conductivity, so an aluminium conductor needs roughly 1.64 times the cross-section to move the same current.
That ratio draws a hard line. Where there is room for fatter cable, in overhead transmission, busbars and building risers, aluminium has done the job for decades. Where there is not, in motor windings and fine electronics and anything tight or heat-constrained, it cannot, at any price.
What pushes users across that line is relative cost, and relative cost has never been this lopsided. At 4.3, the ratio is 16.2% past its long-run average. Per J.P. Morgan, substitution runs at roughly 2% of copper demand today, rising to about 6% by 2030. That is 565 kt now and 1,694 kt then, a tripling, and the 2030 figure alone is 3.75 times a full year of copper demand growth.
None of that is speculative. It is the mechanism that has resolved every previous copper squeeze, working exactly as designed.
The problem is where it empties.
2. The valve empties into a tank with 0.06 days in it
Aluminium looks like the obvious relief. It is abundant, recyclable and produced at 74,000 kt a year. On any supply-side view there is plenty.
The supply-side view is the wrong one.
LME inventories are at a 36-year low, exchange stocks having halved during 2026 to around 250,000 tonnes. Of the 245,250 t available at end-July, 95% was Russian, sanctioned out of Western consumption. What remains is about 12,263 tonnes of non-Russian metal on warrant.
Twelve thousand tonnes. That is 0.06 days of world production, ninety minutes of global output, sitting in warehouses as the entire free float a Western buyer can actually reach. Indian metal in LME sheds fell from 236,000 t to 12,450 t in a year, down 94.7%, and most of what is left is reportedly held by a single participant.
Now put the substitution flow beside it. The 1,694 kt of displaced copper arriving by 2030 is 138 times that entire free float. Against world production it is a rounding error, 2.29%.
That gap between the two comparisons is the whole risk. Substitution is trivial next to how much aluminium the world makes, and overwhelming next to how much it can lay hands on. So it does not show up as a shortage. It shows up as a bidding war for the small pool of metal that is actually available, and the winner is whoever needs it most urgently.
The producer who could normally end that argument cannot. Per USGS, China is **60.81% of world production and pinned at its administrative ceiling: 45,000 kt of output against 45,000 kt of permitted capacity, 100.0%, while supplying 83.3% of all world production growth in 2025. The swing supplier has no swing left.
3. And then someone bombed the smelters
On 28 March 2026, Iranian missiles and drones hit EGA's Al Taweelah in Abu Dhabi and Alba in Bahrain, the two largest aluminium plants outside China and Russia.
The GCC holds 6,330 kt of smelting capacity, 8.55% of world production, and 5,940 kt of it, 8.03% of world, sits inside Hormuz. Only Oman's Sohar, at 390 kt, is on the safe side of the strait.
What makes this semi-permanent is not blast damage. It is chemistry. Smelting runs at 13–15 MWh per tonne, and if the current stops for even a few hours the molten bath freezes into rock inside the cells. Restarting costs on the order of a thousand times what restarting a coal-fired unit costs.
Which produces the most transferable finding in this whole file, per the operators' own reporting. Qatalum was warned. QatarEnergy told it a fuel shortage was coming; it executed a controlled 40% shutdown, took no physical damage, and may be back at full output by Q4 2026. Alba and EGA were attacked without notice. Alba is running at about 30% of its 1.62 Mt capacity, and EGA faces roughly 12 months to restore.
Same event. Same technology. Same region. The difference between a controlled outage and a year-long one was whether the operator got a phone call.
For any continuous-process asset, notice period is a material variable in its own right, separate from how hard it was hit. That belongs in a risk model, not an anecdote.
One more layer, because it shows how these failures stack. Per USGS, Guinea is 34.09% of world bauxite and refines 0.24% of it, and in August 2025 Guinea revoked the bauxite licences of a UAE aluminium producer's subsidiary, handing them to a state-backed company. EGA lost its feedstock seven months before it lost its plant. Two unrelated failures, in sequence, on the same asset. A resilience review that kept resource nationalism and physical security in separate registers would have scored that smelter safe on both.**
4. Where the bill lands: the ripple, sector by sector
Now the part that matters. A copper problem became an aluminium problem. Here is who pays, and how.
4.1 Power grids, squeezed on both metals at once
Grids are the worst-positioned buyer in this system, because both of their options are constrained simultaneously.
Transmission is copper's single largest structural demand driver at roughly 4.7 Mt by 2030. It is also the classic aluminium application, since overhead lines have used it for a century. So a grid operator facing expensive copper does the textbook thing, switches to aluminium, and discovers the free float is ninety minutes of world production.
Impact: cost and schedule, on projects that cannot be deferred. Grid build-out is policy-driven and deadline-bound, against interconnection queues, renewable connection targets and data-centre commitments. This is the sector with the least room to wait for prices to normalise, which means it will pay whatever clears, and in doing so set the price everyone else pays.
4.2 Data centres need both, and compete with the grid for each
Copper intensity runs 27–47 t/MW in-facility, and 100–150 t/MW including transmission, substations and redundant feeds. Those are two different denominators and must never be blended. A 1 GW campus therefore needs 30,000–47,000 t of copper inside the fence, or 100,000–150,000 t counting its grid connection.
Aluminium arrives too, as busbars, enclosures and cable.
Impact: the announced Gulf compute pipeline is a claim on both metals, arriving exactly as regional smelting sits offline. And the grid connection, the bigger copper number by far, puts data centres in direct competition with the utilities they depend on. They are bidding against their own supplier.
4.3 Solar, hit through a door it never watches
Module frames and mounting structures are aluminium-intensive, and Gulf metal was heavily directed to Asian solar manufacturing.
Impact: solar module costs take a hit from a Gulf missile strike, through aluminium, with no involvement from silicon, polysilicon, wafers or tariffs, the four things solar analysis actually monitors.
This is the clearest third-order case in the article. Nobody covering solar supply chains had a Hormuz smelter on their risk register, and the transmission path runs entirely through a metal the sector treats as a commodity input rather than a strategic one.
4.4 Electric vehicles, the one sector with no escape
Per the vault's EV work, an EV uses roughly 3–4 times the copper of a combustion car, 83 kg against 23 kg, in motors, wiring and charging. It simultaneously uses aluminium for lightweighting: bodies, closures, battery enclosures. Transport is already 36% of US aluminium demand.
Impact: EVs are the only major sector that cannot substitute its way out, because it is long both metals at once. Every other buyer here has a lever. Carmakers have the exposure and none of the optionality, and they are competing for aluminium against grid operators who can pay more and cannot wait.
4.5 Construction, biggest exposure and most flexibility
Building construction is 42% of US copper-product demand and 13% of US aluminium.
Impact: real, but absorbed rather than transmitted. Construction is the most price-elastic user in both metals, and the one most able to redesign, re-specify or simply defer. Historically that is the quiet mechanism by which metal squeezes resolve, as demand steps back before supply steps up. Expect volume destruction here rather than crisis headlines.
4.6 Packaging pays the most and deserves it the least
Packaging is 24% of US aluminium demand and has no copper exposure whatsoever.
Impact: a pure pass-through of somebody else's problem. A canmaker's input cost rises because grid operators, data centres and carmakers are bidding for the same metal, for reasons that have nothing to do with packaging and cannot be influenced by it.
There is a redeeming feature, and it is genuinely the most useful thing in this section. The used beverage can is the highest-return scrap loop in any metal. Secondary supply responds to price faster than any smelter can be built or restarted. So packaging is both the least deserving payer and the fastest genuine source of relief in the entire system. The sector that gets squeezed is the one that ends the squeeze.
5. The signal to watch, and it is not the price
The most useful diagnostic here is that aluminium's price is not at a record, and that is the interesting part.
Aluminium peaked around $3,750/t in early June 2026, 92.1% of the 2022 record of $4,073/t, and sat at $3,234/t on 19 August, 79.4% of the record. A 36-year inventory low with the price a fifth below its high is not what a textbook shortage looks like.
The stress went somewhere else. The US Midwest physical premium hit a record $1.10/lb = $2,425/t, of which $679/t is more than the 50% tariff alone explains. 28.0% of the record premium is not tariff at all.
When exchange price and physical premium disagree, the exchange price is describing paper and the premium is describing metal. They are disagreeing now. Watch the premium.
6. What would break this argument
Three things, and they are real rather than decorative.
The substitution path is one forecaster's number. J.P. Morgan's 2%-to-6% is not a consensus, and the 1.64× conversion is a conductivity ratio rather than an observed demand elasticity. Our confidence is ordinal, not cardinal. The direction holds, the precision does not, and anyone building a position on the exact tonnage is over-reading it.
Aluminium substitutes both ways. Composites, steel, magnesium, titanium, glass, plastics and wood all take share back if aluminium runs. That two-sided elasticity is precisely why aluminium has never behaved like copper, and it is a genuine cap on any squeeze.
Scrap is doing more than any forecast credits. Copper's 6,000 kt refining-versus-mining gap is already being closed by secondary supply. If scrap scales with price, and packaging says it does, both squeezes resolve earlier and far more quietly than the tonnage arithmetic implies.
Sources
- authoritative · USGS Mineral Commodity Summaries — Copper — mine supply flat at 23,000 kt across 2024–25; China 48.28% of refining against 7.83% of mining
- authoritative · USGS Mineral Commodity Summaries — Aluminum and Bauxite — world production 74,000 kt; China 60.81% and its 45,000 kt ceiling; Guinea 34.09% of bauxite and 0.24% of alumina; the August 2025 licence revocation
- authoritative · IEA — critical minerals and copper lead times — the ~17-year discovery-to-production lead time; Chinese smelting at 50% of global capacity
- authoritative · ICSG — copper chain and end-use splits (
icsg.org) — the enrichment chain; construction at 42% of US copper-product demand. ⚠ the domain resolves but was unreachable on both HTTP and HTTPS when checked 2026-08-20 — server-side or network-side, we could not determine which. Retained because it is the industry's authoritative body and [[01-Knowledge/Commodities/Copper]] already cites it; the URL is given unlinked so a dead link is not published - researched · J.P. Morgan — copper-to-aluminium substitution — ~2% of copper demand now, ~6% by 2030. ⚠ one forecaster's path; not a consensus and not an observed elasticity
- researched · LME — aluminium stocks and warrant composition — the 36-year inventory low; 95% of the 245,250 t at end-July Russian; Indian metal down from 236,000 t to 12,450 t; the record Midwest premium
- researched · EGA / Alba / Qatalum — March 2026 outage reporting — the 28 March strikes; Alba at ~30% of 1.62 Mt; EGA at ~12 months; Qatalum's warned and controlled 40% shutdown
- researched · Wood Mackenzie — copper demand outlook — the grid, renewables, EV and data-centre demand streams
- authoritative · USGS / Aluminum Association — US aluminium end use — transportation 36%, packaging 24%, building 13%
- scaffold · In-session arithmetic across 01 Knowledge/Commodities/Copper and 01 Knowledge/Sectors/Aluminium — the 3.00× substitution multiple, the 138×-of-free-float and 2.29%-of-production comparisons, the 0.060-day free float, the 1 GW campus copper ranges, and the 28.0% non-tariff share of the record Midwest premium. ⚠ not an external source. The sector-by-sector ripple in §4 is our construction from the two notes' demand splits — no source models it as a chain, and the packaging conclusion in §4.6 is ours
Continue the thread
Get the next material change, not the next headline.
Receive new UFOQ briefings and concise signal updates when the evidence changes enough to matter.