Higher energy costs raise farm costs mainly through fertiliser—not diesel
The immediate fuel bill is visible, but nitrogen fertiliser and the farmer's response determine the larger and more persistent change in agricultural production cost.
- Horizon
- Immediate · Next planting cycle
- Signal strength
- High on direction · Medium on magnitude
- Decision lens
- Agriculture · Energy · Food security
- Reading time
- 10 minutes
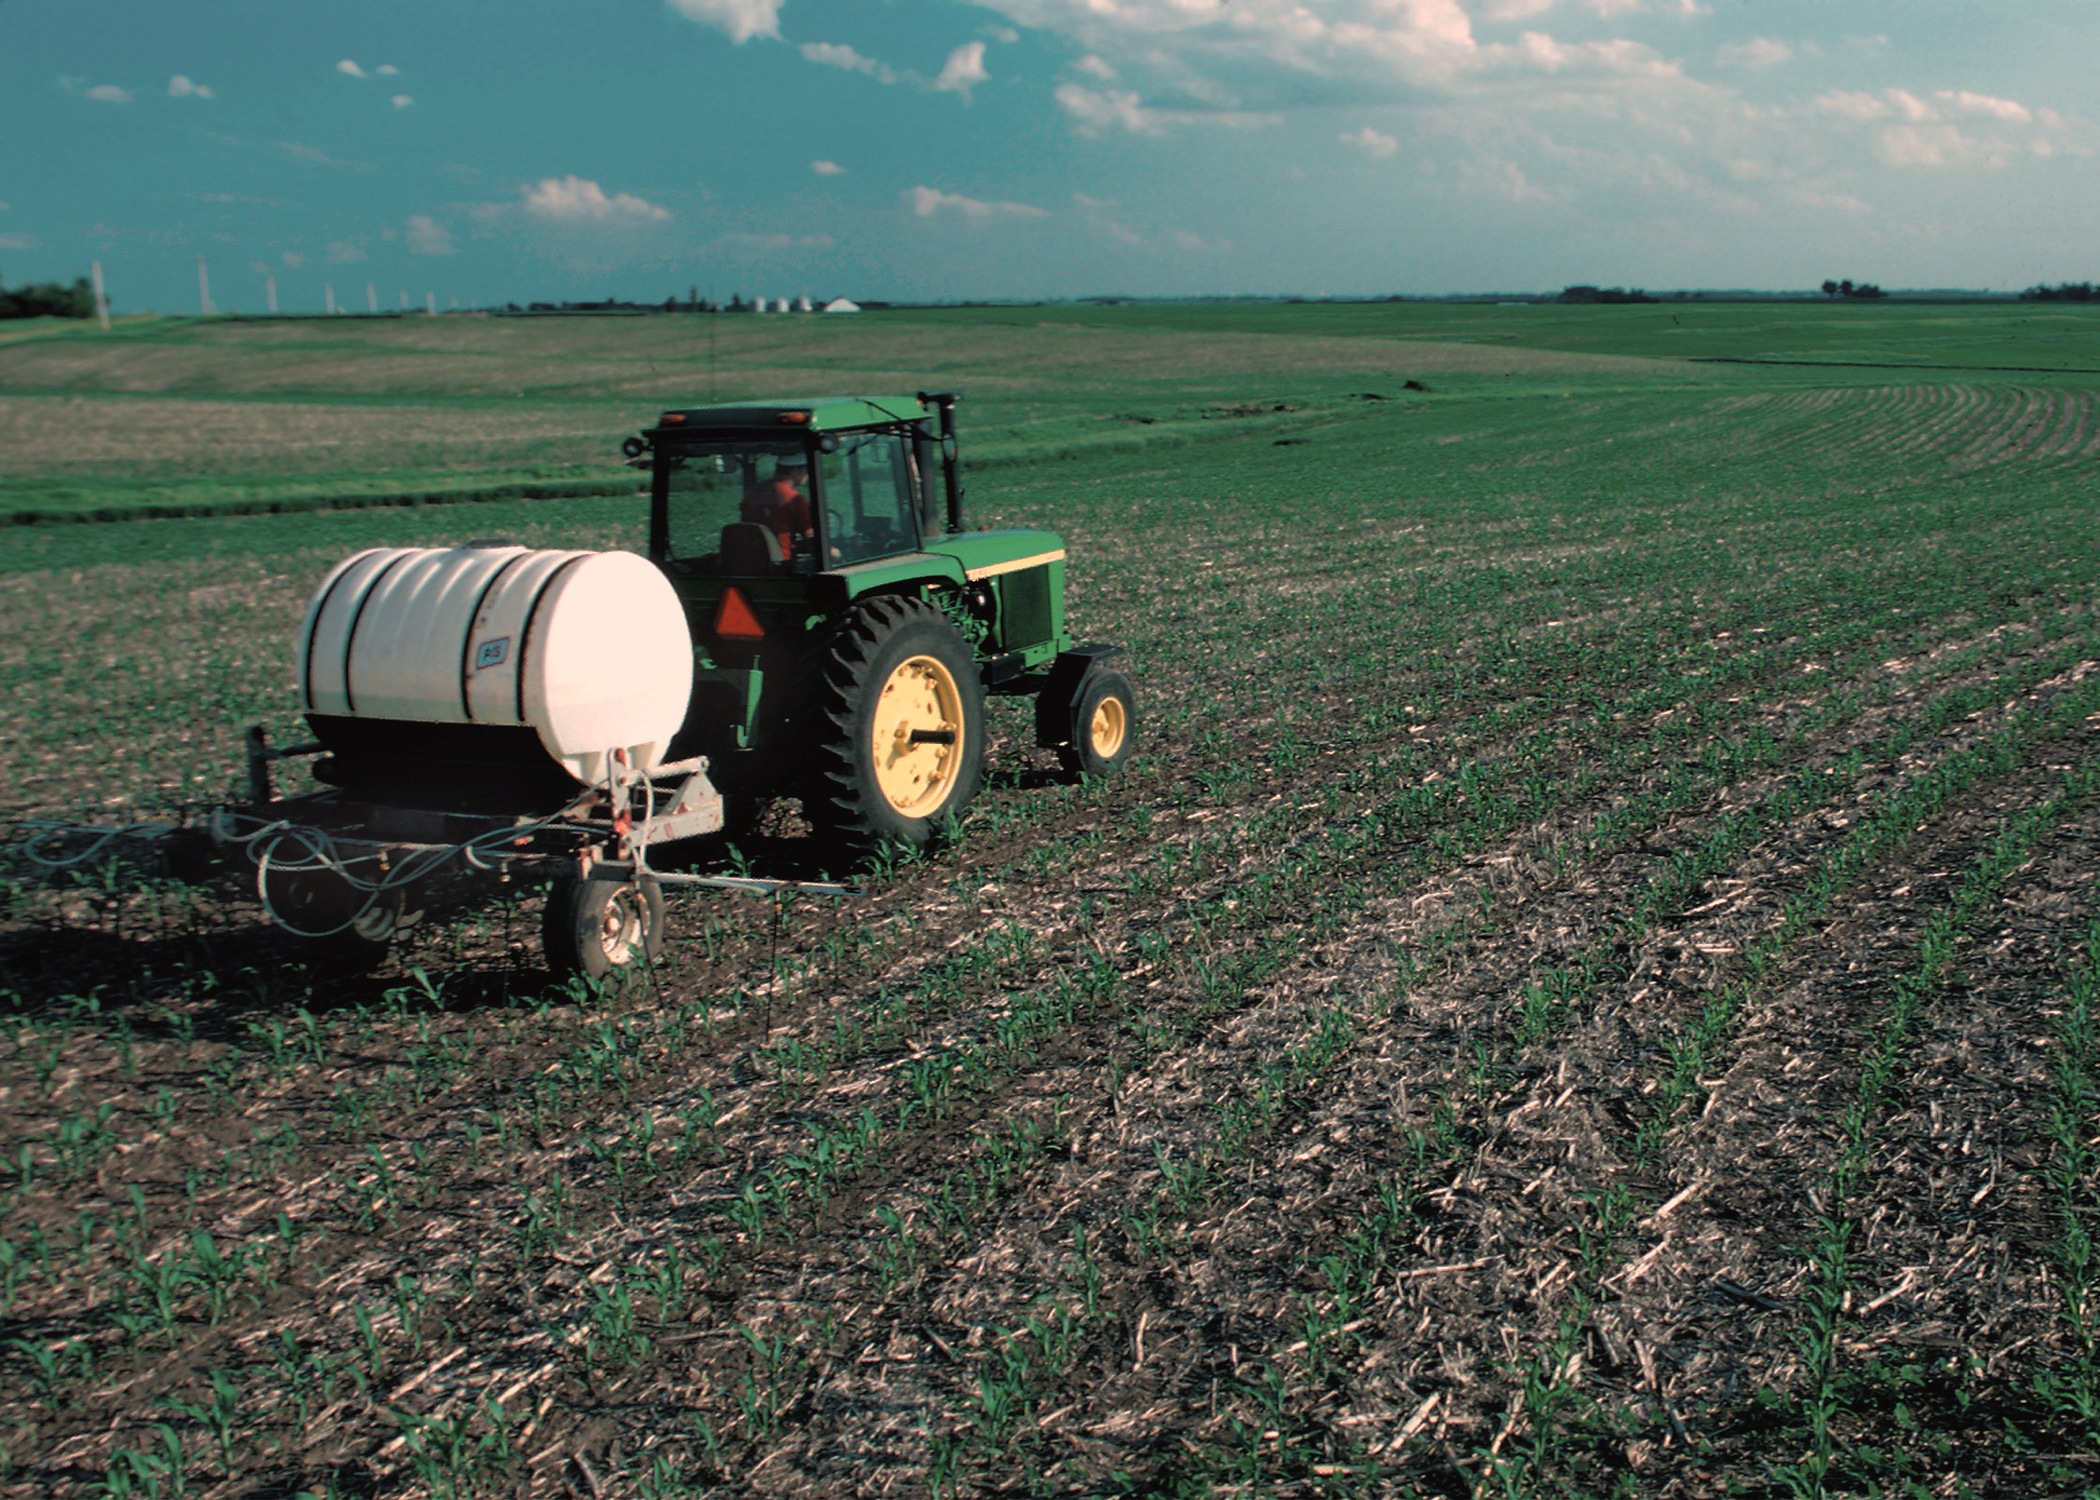
For many crop systems, higher energy costs reach the farm more forcefully through nitrogen fertiliser than through the diesel tank.
Natural gas is both feedstock and process energy for the dominant ammonia route, while fertiliser represents a materially larger expense than fuel in the available U.S. crop-farm benchmark. Direct fuel and electricity still matter most for mechanised, irrigated, heated, cooled and drying-intensive operations.
The farm bill and the unit cost can move in opposite directions. Farmers can respond by applying less fertiliser, reducing acreage or changing crops; cash expenditure may then remain stable while lower output pushes the cost per tonne higher. Contracts, inventories and policy support determine how quickly the shock arrives.
Public evidence brief5 cited findings behind the assessment
Question answered
How will higher energy costs affect agricultural production costs?
This evidence layer is public and citable. The complete analysis, rankings, calculations, scenarios, and decision implications continue below.- Geography
- Global · United States
- Sectors
- Crop production · Nitrogen fertiliser · Energy · Farm services
- Risk classes
- Input-cost inflation · Margin compression · Yield risk · Supply-chain pass-through
- Potential impact
- Material cost and yield pressure for nitrogen-intensive, irrigated and import-dependent producers with weak margins
- Time horizon
- Immediate · Next planting cycle
Key findings and source trail
The evidence an outside reader can verify.
- 01
Energy and fertiliser prices do not move together immediately.
The World Bank's September 2026 update reported an 8.8% monthly rise in its energy index and a 10.1% rise in natural gas, while the fertiliser index fell 1.9%.
- 02
Nitrogen fertiliser carries a structural natural-gas dependency.
The IEA's baseline places more than 70% of ammonia production on the natural-gas steam-reforming route.
- 03
Fertiliser has greater mechanical cost leverage than fuel in the current U.S. crop benchmark.
USDA recorded fertiliser, lime and soil conditioners at 11.3% of 2024 crop-farm expenditure, compared with 3.8% for fuel.
- 04
The fertiliser line can dominate production-cost changes for nitrogen-intensive crops.
USDA estimated U.S. corn fertiliser cost rising from an average USD 125 per acre in 2006–2021 to USD 225.78 in 2022, about 24% of total corn production cost.
- 05
The largest production effect can arrive after the initial energy shock.
An OECD-FAO 2026 scenario linked a 53% oil-price shock to a 47% fertiliser-price increase, with larger agricultural price effects in the following year after input buffers were exhausted.
Risk transmission
How the exposure reaches the decision.
- 01
Oil, gas and electricity prices raise direct farm energy costs and ammonia-production costs.
- 02
Contracts, inventories and trade conditions determine the pass-through into fertiliser and farm-service prices.
- 03
Farmers absorb the cost, reduce inputs, switch crops or reduce acreage at the next production decision.
- 04
Lower yield or output can raise the cost per tonne even when total cash spending changes little.
Entities and topics
- World Bank
- International Energy Agency
- USDA
- OECD-FAO
- Ammonia producers
- Crop farms
Higher energy costs will raise agricultural production costs, with high confidence in the direction but only medium confidence in the global magnitude. The result varies too much by crop, country, energy source, contract structure and farm response to support one global percentage.
The decisive channel for many crop systems is not the diesel tank. It is nitrogen fertiliser. Natural gas is both a feedstock and an energy source for the dominant ammonia-production route, while fertiliser is a larger farm expense than fuel in the available current United States crop-farm benchmark. Direct fuel and electricity remain more important for mechanised, irrigated, heated, cooled and drying-intensive operations.
The main blind spot is that expenditure and unit production cost can move differently. A farmer facing higher input prices can buy less fertiliser, reduce acreage or change crops. Total cash spending may then rise only modestly—or even fall—while output falls enough to raise the cost per tonne. Energy prices also do not pass into fertiliser immediately or one-for-one.
1. What is happening now
The energy-cost trigger is active, but the fertiliser channel has not moved in lockstep.
The World Bank's September 2026 commodity update reported that its energy price index rose 8.8% in August, with natural gas up 10.1% and crude oil up 5.7% from July. Over the same month, the fertiliser price index fell 1.9%. These are global benchmark movements, not the prices paid by an individual farm, but they establish two facts: energy costs were rising, and immediate fertiliser pass-through was incomplete.
That divergence matters. It shows why an oil or gas price move cannot be multiplied directly by a farm-cost share. Fertiliser prices also reflect plant location, gas contracts, ammonia and finished-product inventories, trade routes, freight, sanctions, export policy and regional spare capacity.
2. The signals that matter
Five signals support the cost mechanism; one current signal limits how confidently it can be sized.
| Signal | What it establishes | What it does not establish |
|---|---|---|
| World Bank energy index +8.8% in August 2026 | A current global energy-price trigger | A farm-level fuel-price increase of the same size |
| World Bank fertiliser index −1.9% in the same month | Pass-through can be delayed or offset | Permanent separation between energy and fertiliser |
| More than 70% of ammonia used natural-gas steam reforming in the IEA's 2020 baseline | A strong physical link between gas and nitrogen fertiliser | Each plant's current gas cost or hedge |
| Fertiliser was 11.3% and fuel 3.8% of 2024 U.S. crop-farm expenditure | The indirect fertiliser channel can outweigh direct fuel | A global cost structure |
| OECD-FAO's 2026 scenario produced a 47% fertiliser-price increase from a 53% oil-price shock | The modelled chain can become economically material | A universal elasticity or an observed outcome |
Historical experience supports the exposure. USDA estimated that fertiliser cost for U.S. corn rose from an average USD 125 per acre during 2006–2021 to USD 225.78 in 2022, when it reached about 24% of total corn production cost. Corn is nitrogen-intensive, so this should not be generalized to every crop. It does show that the fertiliser line can reprice enough to dominate the cost change.
3. How the impact travels
The cost shock reaches farms through three direct routes, then changes behaviour at the next planting or production decision.
First, fuel suppliers pass higher petroleum costs into diesel, gasoline and liquefied petroleum gas. Mechanised farms receive the effect through tractors, combines, generators and other equipment. The lag can be days or weeks, but fixed-price contracts, fuel inventories, subsidies and hedging can delay it.
Second, gas-based ammonia producers face higher feedstock and process-energy costs. The IEA's structural baseline places just over 70% of ammonia production on the natural-gas steam-reforming route. Producers may absorb the change, raise ammonia and nitrogen-fertiliser prices, reduce operating rates or redirect supply. Farm exposure begins when distributors and farmers replace inventory or renew contracts, often months after the original energy move.
Third, electricity and fuel costs enter irrigation, greenhouse heating, ventilation, cooling, crop drying, fishing, aquaculture and contracted field services. These costs may arrive through the utility bill or through a supplier's revised service price. A farm with renewable generation, efficient pumps, rainfed production or a fixed tariff has a different exposure from a farm pumping groundwater or operating a controlled environment.
The second-order effect begins when the farmer responds. The available choices are to absorb the cost in margin, reduce input volume, switch crop or production method, reduce acreage, delay an operation, or invest in efficiency. Only after that decision can the analyst estimate the effect on yield, output and cost per tonne.
4. Scale and distribution of the impact
A useful benchmark suggests that fertiliser has roughly three times the direct cost leverage of fuel for U.S. crop farms, but the benchmark is not a global forecast.
According to USDA, U.S. crop farms recorded USD 252.3 billion of expenditures in 2024. Fertiliser, lime and soil conditioners accounted for USD 28.4 billion, or 11.3%. Fuel accounted for USD 9.5 billion, or 3.8%.
Holding quantities and every other expense constant produces the following sensitivity:
| Fixed-quantity price change | Mechanical change in total U.S. crop-farm expenditure |
|---|---|
| Fuel prices +10% | +0.38% |
| Fertiliser-category prices +10% | +1.13% |
| Both categories +10% | +1.50%, or about USD 3.79 billion |
The calculation is deliberately narrow. It excludes electricity and supplier pass-through in transport, irrigation services, chemicals and machinery. It also treats fertiliser, lime and soil conditioners as one category even though only part of that category is tightly linked to energy. It therefore demonstrates leverage, not a forecast.
Exposure is concentrated differently across agriculture:
- Nitrogen-intensive cereals: fertiliser is the main energy-transmission channel. Wheat and corn are more exposed than nitrogen-fixing crops or systems drawing on soil reserves and organic nutrients.
- Irrigated and controlled-environment production: electricity or fuel for pumping, heating, ventilation and cooling can be material even where fertiliser intensity is moderate.
- Mechanised field crops: diesel reaches the cost base quickly during planting and harvest windows.
- Livestock: the larger effect is often indirect. In USDA's 2024 benchmark, feed represented 31.5% of U.S. livestock-farm expenditure. OECD-FAO's scenario found stronger price effects for feed-intensive poultry and pigmeat than for grazing-based beef.
- Import-dependent, lower-income systems: exposure rises when farms lack inventories, affordable credit, subsidies, domestic fertiliser supply or alternative import routes.
5. The overlooked point
Lower farm spending does not necessarily mean lower production cost. The denominator may be falling faster than the bill.
Suppose a farmer responds to expensive fertiliser by applying less. Cash expenditure on fertiliser may decline. If the lower application reduces yield, however, fixed expenses such as land, machinery and finance are spread across fewer tonnes. The cost per hectare may stabilize while the cost per tonne rises.
This distinction is visible in the OECD-FAO mechanism. In its 2026 scenario, an oil price of USD 115 per barrel—53% above baseline—raised modelled global fertiliser prices by 47%. Higher fertiliser prices reduced application rates, with larger production effects arriving in 2027 after previously purchased inputs had buffered the 2026 crop. The model estimated average agricultural commodity prices 4.5% above baseline in 2026 and 8.3% above baseline in 2027.
Those figures are conditional model outputs, not observed results. Their value is in showing the sequence: energy price, fertiliser price, input decision, yield and output. An analysis that stops at the farm's cash bill misses the later increase in unit cost.
6. What could weaken the conclusion
The strongest opposing case is that the energy shock remains upstream and never becomes a material farm acquisition-cost shock.
That can happen. Low-cost gas contracts can protect ammonia plants. Inventories and forward purchases can bridge a crop season. Governments can reduce duties or subsidise fuel and fertiliser. Farms can use soil nutrients, manure, legumes, precision application, no-till practices, more efficient irrigation or renewable electricity. Suppliers may also absorb part of the shock when farm demand is weak.
The August 2026 energy-fertiliser divergence is direct evidence for this opposing case. It does not overturn the structural mechanism, but it lowers confidence in immediate magnitude. The conclusion would weaken materially if farm diesel and electricity tariffs, fertiliser dealer prices and contracted service rates remain stable through the next relevant planting cycle despite persistently higher wholesale energy prices.
Commodity prices are another buffer. If crop selling prices rise with input costs, the farm's production cost still rises but its margin may not fall. Cost, revenue and profitability must therefore be measured separately.
7. What happens next
The base case is a staggered cost increase: direct energy first, fertiliser and service contracts next, and yield or unit-cost effects at the following production decision.
In a contained path, wholesale energy prices normalise or existing contracts, inventories and policy support bridge the shock. Direct fuel bills rise temporarily, while fertiliser acquisition costs and input use change little.
In a sustained path, higher gas, oil, electricity and freight costs survive into new fertiliser and farm-service contracts. Nitrogen-intensive and import-dependent producers face the largest cost increase. Farmers with weak margins reduce application or switch crops, moving the effect from expenditure into yield and cost per tonne.
In an amplified path, the energy shock coincides with fertiliser-plant outages, export controls, freight disruption, drought or expensive credit. These are separate shocks and should not be attributed to energy alone, but together they can remove the buffers that normally contain the cost increase.
8. Signposts to monitor
| Signpost | Confirmation signal | What it tests | Window |
|---|---|---|---|
| Farm diesel, LPG and electricity prices | Sustained increase relative to pre-shock contracts | Direct farm-energy channel | Weekly to monthly |
| Natural-gas, ammonia and urea prices | Fertiliser prices rise after gas and remain elevated | Gas-to-nitrogen channel | Monthly |
| Fertiliser dealer inventories and forward prices | Lower cover or higher replacement cost before planting | Timing and buffer strength | Before each planting season |
| Fertiliser sales and application rates | Volume declines after acquisition prices rise | Farmer behavioural response | Planting and application windows |
| Crop mix and planted area | Movement toward less energy- or nitrogen-intensive production | Substitution | One crop season |
| Yield after controlling for weather | Yield underperforms where input use fell | Input-to-output link | Harvest |
| Farm expenditure and output together | Expenditure falls but cost per tonne rises | The denominator blind spot | Annual accounts |
Conclusion
Higher energy costs raise agricultural production costs, but the correct unit and transmission path determine the answer. Direct fuel and electricity costs move first. For many crop systems, the larger channel is nitrogen fertiliser, with a lag determined by gas contracts, inventories, trade and the planting calendar. The largest vulnerability is not necessarily the farm with the largest fuel bill; it is the producer combining high nitrogen, irrigation or controlled-environment intensity with weak margins and few buffers.
The direction of effect is strongly supported. A single global magnitude is not. The current evidence supports crop- and geography-specific sensitivity analysis, with separate measures for total expenditure, cost per hectare, cost per tonne and farm margin.
Sources
- authoritative · World Bank, Commodity Markets, latest price update published 2 September 2026 — August 2026 changes in the energy, natural-gas, crude-oil and fertiliser price indexes.
- authoritative · International Energy Agency, Ammonia Technology Roadmap — Executive Summary, 11 October 2021 — 2020 global ammonia-production routes and the natural-gas dependency.
- authoritative · USDA National Agricultural Statistics Service, Farm Production Expenditures 2024 Summary, 25 July 2025 — 2024 U.S. crop- and livestock-farm expenditure totals and fuel subcomponents.
- authoritative · USDA Economic Research Service, Fertilizer share of expected corn production expenses drops back after 2021–22 spike, 27 March 2024 — U.S. corn fertiliser cost per acre and share of total cost.
- authoritative · OECD and FAO, The impact of the conflict in the Middle East on agricultural markets, 29 June 2026 — Aglink-Cosimo energy and fertiliser cost scenario, timing, commodity-price and production effects.
- scaffold · Internal arithmetic from USDA NASS 2024 expenditure totals, calculated 13 September 2026 — expenditure shares and fixed-quantity 10% sensitivity. This is not an external forecast.
Continue the thread
Get the next material change, not the next headline.
Receive new UFOQ briefings and concise signal updates when the evidence changes enough to matter.