In the grid queue, money buys nothing. Position does.
Grid equipment is allocated by slot, not price. Every operator escaping the connection queue lengthens it, and the fix for grid stability competes for the same factories.
- Horizon
- Immediate · 2026–2031
- Signal strength
- High on queues and lead times · Medium on bottleneck migration
- Decision lens
- Data centres · Power infrastructure · Capital allocation
- Reading time
- 11 minutes
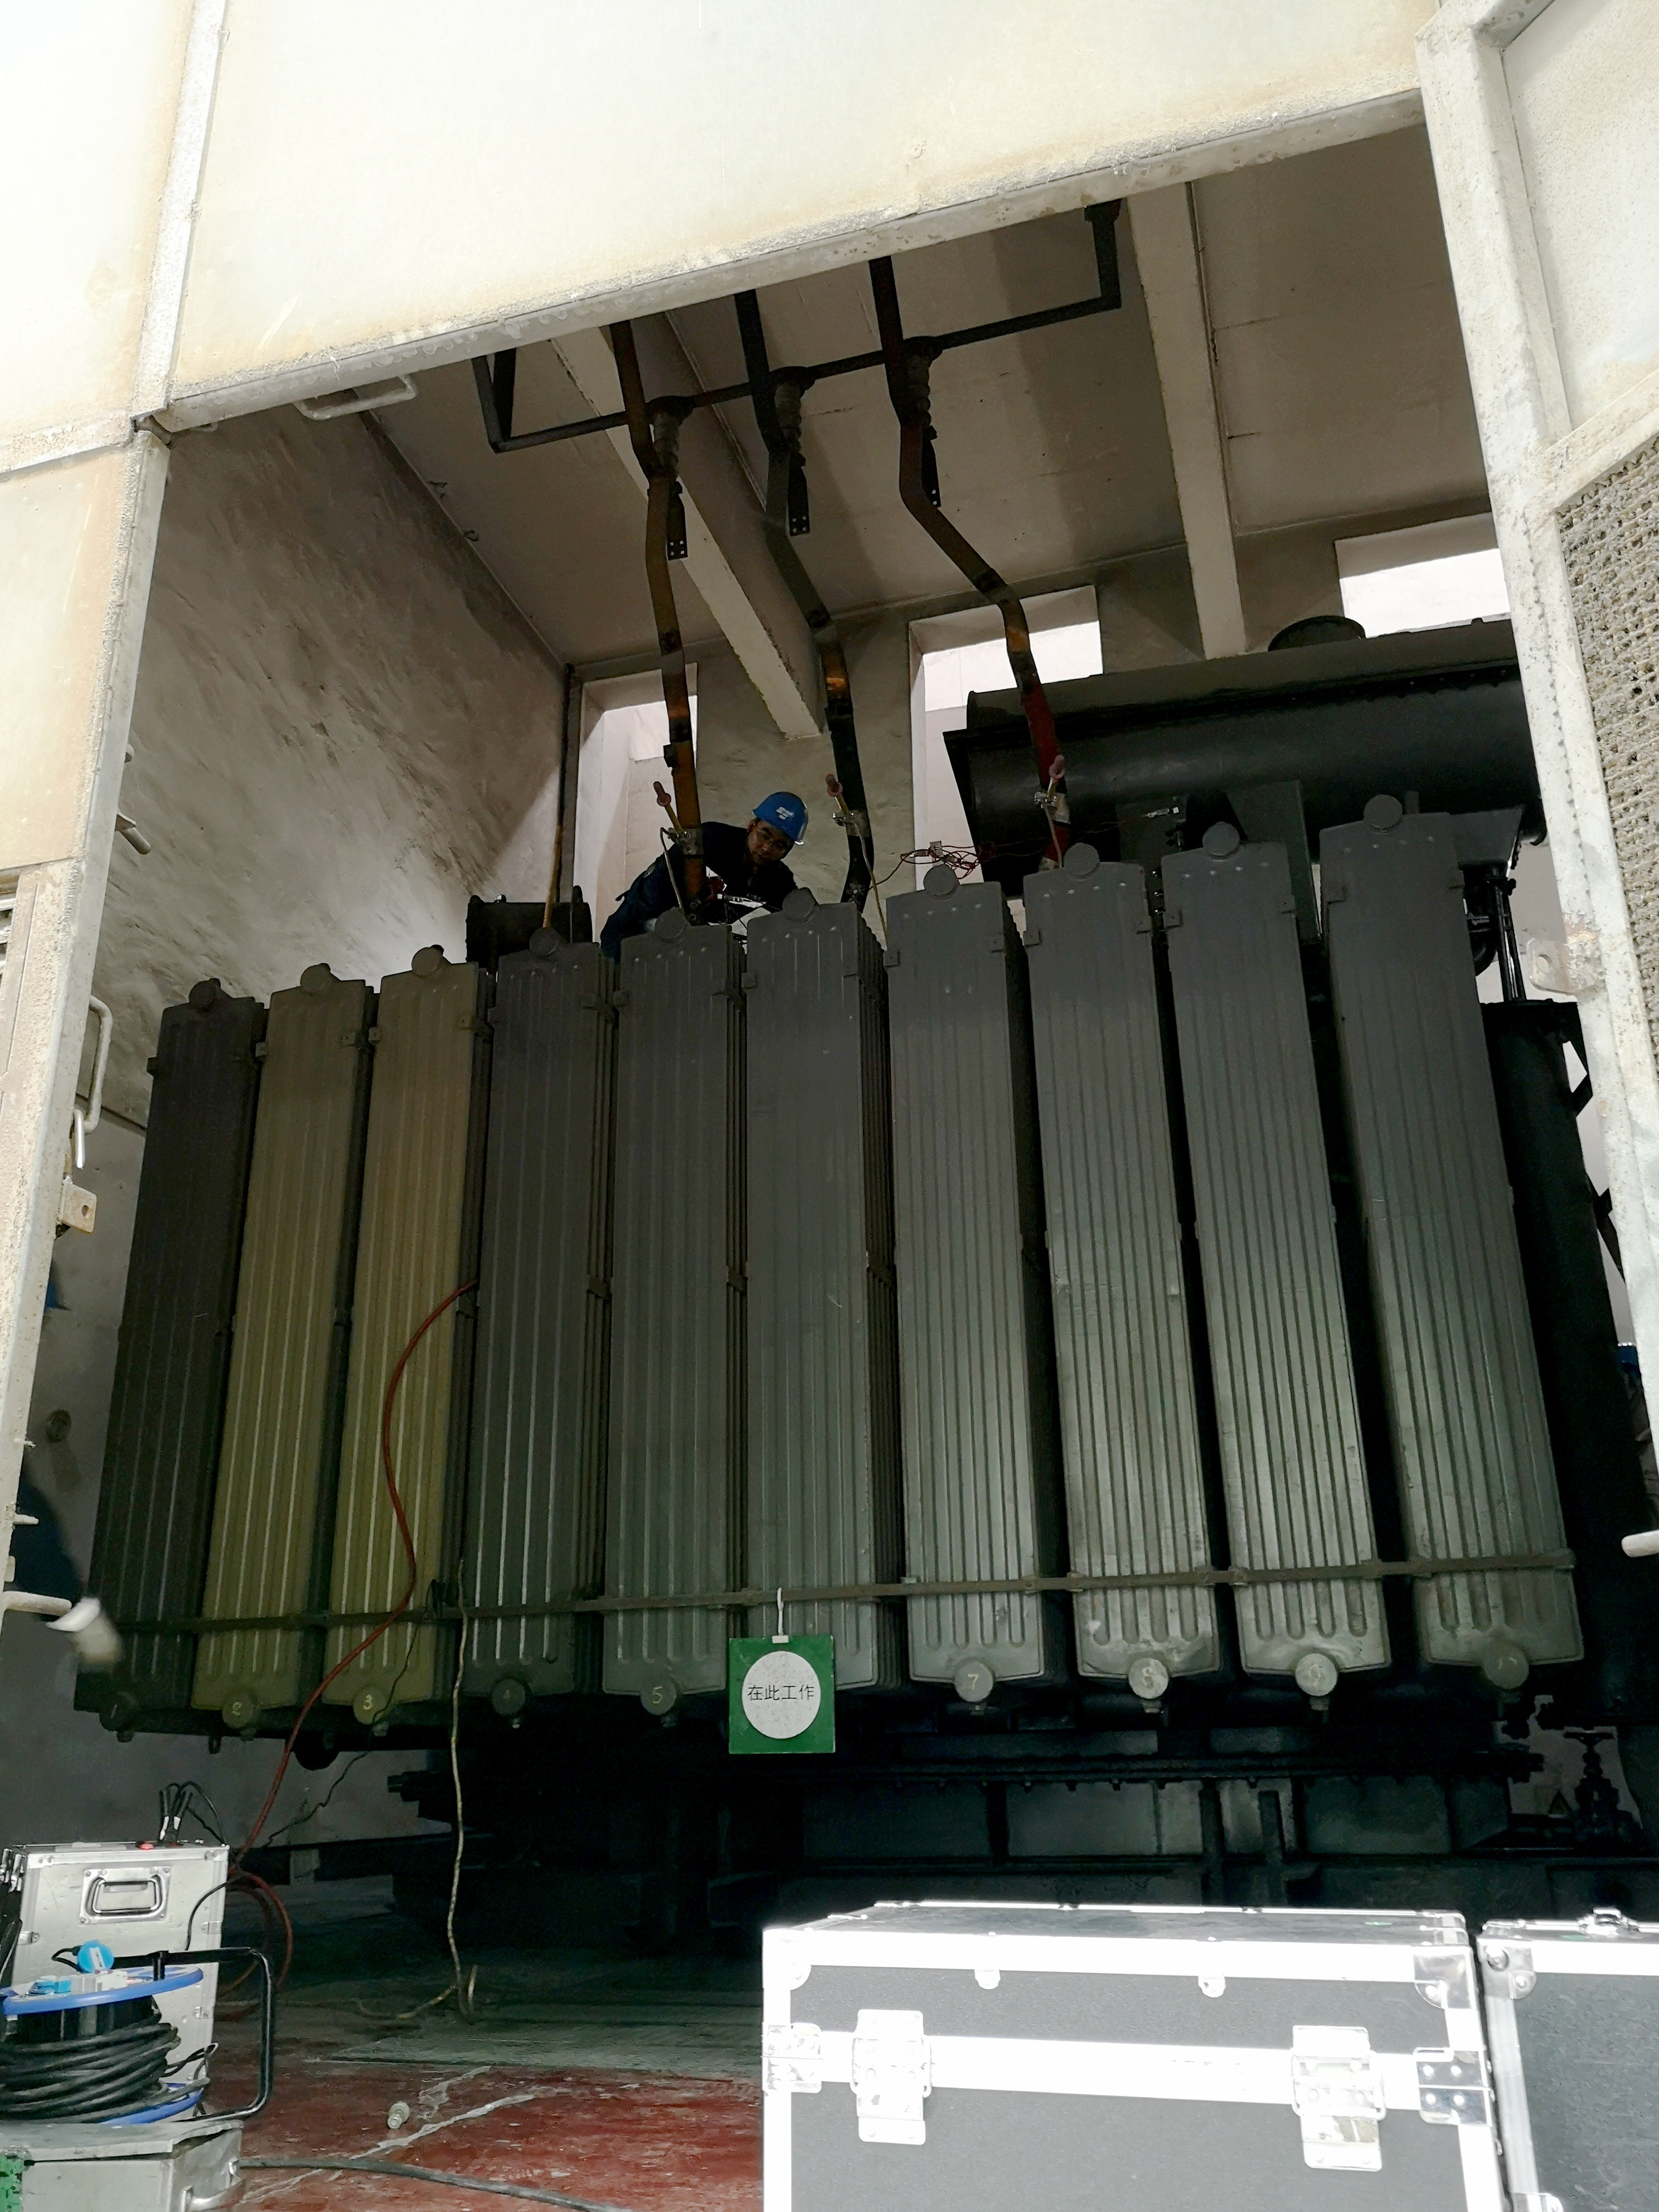
For large power users, electricity is no longer cleared by price alone: access is being allocated through equipment and interconnection slots.
Data-centre developers face three different clocks: two-to-four-year transformer lead times, turbine order books extending into 2030–31, and five-to-ten-year interconnection waits where transmission upgrades are required. Treating those as one generic wait hides which constraint a project actually carries.
Behind-the-meter generation can move a project from the grid queue into the turbine queue, but it does not remove the manufacturing constraint. Transformer, turbine, renewable-interconnection, and grid-stability programmes draw on overlapping heavy-electrical capacity, so one operator's workaround can lengthen another's delivery date.
Public evidence brief5 cited findings behind the assessment
Question answered
What actually limits electricity supply for AI data centres?
This evidence layer is public and citable. The complete analysis, rankings, calculations, scenarios, and decision implications continue below.- Geography
- United States · Europe · Gulf · Global
- Sectors
- Data centres · Electricity transmission · Power equipment · Renewable energy
- Risk classes
- Interconnection risk · Equipment bottleneck · Supplier concentration · Grid-stability risk
- Potential impact
- Multi-year energisation delays, stranded site and compute investment, and higher exposure to grid-instability events even where generation capacity appears adequate
- Time horizon
- Immediate · 2026–2031
Key findings and source trail
The evidence an outside reader can verify.
- 01
Transformer lead times and prices have moved well beyond normal procurement assumptions.
The IEA reports lead times of two to four years for large power transformers, prices roughly 75% above 2019 levels, and heavy US reliance on imports.
- 02
The connection queue is larger than the system trying to connect it.
Lawrence Berkeley National Laboratory reports roughly 2,060 GW actively seeking US grid connection at the end of 2025, with projects requiring transmission upgrades facing waits measured in years.
- 03
Data-centre electricity demand is on course to more than double by 2030.
The IEA projects total data-centre electricity consumption rising from 415 TWh in 2024 to about 945 TWh in 2030; the total covers all data centres, not AI alone.
- 04
A large backlog documents sold capacity, not an open market where extra money guarantees an earlier slot.
GE Vernova's filings show a $163 billion group backlog across power, wind, and electrification. The figure demonstrates committed work but should not be treated as unmet demand or multiplied by a gas-turbine subcategory share.
- 05
Administrative reform can unlock capacity without waiting for a new equipment cycle.
RAND modelling places the potential 2030 gain from interconnection reform at 65–130 GW. The range is scenario-based, but it shows that queue design is itself a material supply lever.
Risk transmission
How the exposure reaches the decision.
- 01
Data-centre demand increases faster than grid connections and equipment output.
- 02
Projects compete for interconnection, transformer, and turbine slots rather than clearing solely through price.
- 03
Behind-the-meter workarounds shift demand into the same constrained heavy-electrical manufacturing base.
- 04
Grid-stability procurement adds another claimant on overlapping equipment and skilled labour.
- 05
Delivery dates extend and announced compute capacity remains unenergised.
Entities and topics
- GE Vernova
- Siemens Energy
- Mitsubishi Power
- Cleveland-Cliffs
- Lawrence Berkeley National Laboratory
- Statkraft
Most capital committees treat electricity as a procurement problem. Pay more, move up the list, take delivery sooner. On the grid that is now false, and the people it is false for have mostly not noticed.
Industrial gas turbines cost over $250m a unit on the figures GE Vernova executives gave in June 2026, and the company carries a $163bn audited group backlog in its SEC filings. When a narrow oligopoly — GE Vernova, Siemens Energy, Mitsubishi — is booking into 2030–31, the differentiator between two well-funded data centre operators is not what either will pay. It is which of them holds a slot. Capital has stopped clearing this market, and slot allocation has replaced it.
That inversion has a second-order consequence almost nobody is pricing. Transformers, turbines and the machines that keep a high-renewable grid stable are built by the same narrow heavy-electrical manufacturing base, from the same castings, copper and skilled trades. If that is right, then every grid problem someone else solves makes your energisation date worse — Europe fixing its stability problem lengthens the queue for a data centre in Texas.
No source states that. It is our reading of the value chain, the central claim of this article, and §5 sets out exactly what would have to be true for it to hold and what has not been established.
1. Three clocks, and adding them together describes nothing
The single number in circulation — about seven years to get power — is real, and it describes one of three separate waits. Large power transformers take two to four years to build, on IEA figures. Industrial gas turbines run to roughly four or five years, computed from the 2030–31 booking horizon GE Vernova executives described in June 2026. The interconnection queue, the administrative wait to physically connect, is five to ten years for projects needing transmission upgrades, on Lawrence Berkeley National Laboratory's tracking.
Only the third supports a claim of seven years. So any statement about "years to get power" is unusable until it names equipment, queue, or both — and an operator who hears seven years and buys turbines has not escaped anything, only changed which queue they stand in.
The demand side is not in dispute. The IEA puts data centre electricity consumption at 415 TWh in 2024 rising to about 945 TWh by 2030, a 2.28-times increase computed from those figures, with the 2030 total approximately equal to Japan's entire national consumption. Read the label carefully: that is all data centres, not AI alone, and two separate sources have already merged the two.
The supply side is where it bites. Roughly 2,060 GW was actively seeking connection at the end of 2025, on Lawrence Berkeley National Laboratory figures — about 1.6 times the entire installed US fleet. The queue is no longer a scheduling problem; it is larger than the system doing the scheduling, which means the binding constraint stopped being how much generation exists and became who is allowed to plug in.
Underneath the transformer sits a tighter constraint still. Transformer cores require grain-oriented electrical steel, for which no substitute material exists, and Cleveland-Cliffs is the sole domestic US producer. That sets an absolute ceiling on transformer output regardless of how much assembly capacity is added — building another transformer plant does not help if the core steel is not there. The IEA puts US imports at roughly 80% of large power transformers, with prices up about 75% since 2019, so the fallback is a second concentration stacked on the first rather than a hedge against it.
2. Position, not price, is the currency — and most site plans do not record it
The consequence of a sold-out oligopoly is that the usual lever stops working. A capital committee that can approve an extra 20% on a turbine order cannot convert that into an earlier delivery, because the constraint is a slot and slots are allocated, not auctioned. The organisations that understand this are competing on relationship, order timing and willingness to take standard configurations — not on price.
Two cautions keep this honest. An audited backlog is committed work, not unmet demand: it records what has been sold, not what was turned away. And the roughly 20% data-centre and AI share those GE Vernova executives described applies to the gas power order book, a subset — the $163bn is the group figure spanning power, wind and electrification, so multiplying the two invents a number.
The first move for any operator is an inventory of power paths, not of megawatts. For every site in the plan, record whether it holds a signed interconnection agreement, a firm turbine order or a power purchase agreement. A site with none of the three has no power path, whatever has been announced about it, and belongs in a different column of the plan from a site that has one.
3. The bypass is individually rational and collectively self-defeating
Hyperscalers buy turbines for behind-the-meter supply precisely because utilities cannot connect them fast enough. It is the substitution that defines this sub-sector and, taken one operator at a time, it is the correct decision.
It is also smaller than it looks. Trading a five-to-ten year queue for a four-to-five year turbine wait saves between zero and six years, arithmetic on those two ranges — and the zero end is not rhetorical. Where the queue runs at its fastest and turbines at their slowest, the bypass saves nothing at all, and nobody can know in advance which end of each range they are on.
The trap is what happens when everyone exercises it. Both routes draw on the same heavy-electrical manufacturing base, so each operator escaping the connection queue lengthens the turbine backlog that is the escape. The bottleneck moves; it does not lift. An operator modelling the bypass as a fixed four-year option is modelling a number that their own peers are actively making worse.
The move here is to date the assumption. Any board paper citing a turbine lead time should carry the date of the OEM disclosure it came from, because a lead time quoted from a 2025 statement is not a lead time; it is history.
4. The fix for stability competes with the fix for capacity
Grid inertia is the third constraint and it runs on no clock at all. Conventional plant generates by spinning heavy mass, and that mass injects power automatically in the instant a generator trips. Solar photovoltaics convert sunlight directly with no spinning generator, so they contribute none of it — which means a grid becomes more fragile to sudden supply loss as its renewable share rises, independent of whether it has enough generation, transformers or queue slots.
Spain and Portugal have already run that experiment. Power took about eighteen hours to restore, payment systems went down so shops could not trade, and Spain's largest domestic bank put the cost at around €400m wiped from the Spanish economy on its own calculation. Spain's parliament passed enabling regulation for inertia devices within days, which tells you the regulator agreed the constraint was real and that nobody had priced it beforehand. The property that makes it dangerous is that inertia degrades silently: it is a step function, not a trend, so absence of blackouts is not evidence of adequate inertia.
The mitigation is a synchronous compensator — a 100-tonne machine spinning at 1,500 rpm that supplies rotational mass without burning fuel, letting a grid run a higher renewable share safely. Statkraft operates them in Europe, selling stability as a service rather than energy, which is a genuinely new business model.
And here is the connection this article exists to make. A synchronous compensator competes for the same castings, the same copper and the same skilled trades as a transformer and a turbine. Renewable interconnection, data-centre energisation and now inertia provision are three claimants on one manufacturing base that has been modelled as having two. If that holds, a wave of European stability procurement after the Iberian blackout does not stay in Europe and does not stay in stability — it arrives as longer transformer and turbine lead times for every operator drawing on the same suppliers, including projects with no exposure to inertia whatsoever.
The exposure is not hypothetical for Gulf programmes either. HUMAIN at 6 GW would draw 42.0 TWh a year and meets the same equipment oligopoly as everyone else. Whether Gulf grids face a comparable inertia constraint is a separate question that no source verifies; it is carried here as a hypothesis about the region, not a finding.
5. What would break this argument, and what has not been established
The rivalry claim in §4 is ours and no source states it. It rests on three things being true, and only the first is established.
Established: compensators, transformers and turbines draw on a common heavy-electrical base of castings, copper and skilled trades. Not established: how many synchronous compensators anyone can build a year, and who builds them. The vault records concentration in stability provision as unmeasured — not as small, but as unknown. Also not established: whether post-Iberian procurement volume is large enough to move transformer or turbine lead times at all.
That second gap is the one that decides it. If European compensator demand is trivial against transformer volume, there is no rivalry and this section is the end of the article rather than the middle of it. Nothing in the vault sizes it either way, and this piece does not pretend otherwise.
Three questions would settle it: who manufactures synchronous compensators at scale and at what annual output; what volume European operators have actually contracted since the blackout, as opposed to announced; and whether that volume consumes enough of the shared base to register in published lead times. Until those are answered the claim is a mechanism worth watching, not a finding to plan against — and it is offered here on that basis.
6. What is already decided, and the three things worth watching
Decided, on contracts and physics rather than opinion: turbine delivery into the 2030s, transformer lead times of two to four years, one US source of transformer-core steel with no substitute, a connection queue larger than the installed fleet, and the fact that inertia falls as solar rises. None of that turns on a forecast, and none of it would change inside five years even if every decision from today were correct.
Genuinely open is how fast the administrative clock can move. RAND modelling suggests interconnection reform alone could unlock 65–130 GW by 2030 — a modelled span whose ends should be carried rather than averaged, because the distance between them is roughly the size of the question.
Three events would change the assessment, and each has a shape worth watching for. A named OEM disclosing a shorter booking horizon would be the first real evidence the manufacturing base is rebuilding rather than merely selling out further. A second grid-scale inertia failure in a different synchronous area would move that constraint from demonstrated to systemic. And a signed commercial order for superconducting transmission cable from a named utility — not a pilot, not a funding round — would open a route currently closed by procurement culture rather than by physics.
The standing action is narrow enough to start this quarter: hold the power-path inventory from §2 as a live register, date every lead time in it to its source disclosure, and treat any competitor's announced grid solution as a claim on your own delivery date rather than as someone else's news.
Sources
- authoritative · IEA — Building the Future Transmission Grid — transformer lead times of 2–4 years; prices up ~75% since 2019; ~80% US import dependence for large transformers; Cleveland-Cliffs as sole US source of grain-oriented electrical steel
- authoritative · IEA — Energy and AI — data centre electricity 415 TWh (2024) → ~945 TWh (2030). ⚠ 2.28× is computed in-session, and the figure covers all data centres, not AI alone
- authoritative · GE Vernova — SEC filings — $163bn audited group backlog. ⚠ backlog is committed work, not unmet demand; do not multiply it by the 20% gas-order-book share
- authoritative · LBNL — Queued Up — ~2,060 GW actively seeking connection at end-2025; 5–10 year waits for projects needing transmission upgrades
- researched · CNBC — gas turbine demand, 2026-06-27 — booking into 2030–31; ~20% of the gas power order book is data-centre/AI work; unit cost above $250m
- researched · Bloomberg Originals — the grid rebuilt for AI, 2026-05-27 — the inertia mechanism and Statkraft's synchronous compensators; the Iberian blackout, its ~18-hour restoration and the ~€400m cost on Spain's largest domestic bank's own calculation
- researched · RAND — interconnection reform — 65–130 GW unlockable by 2030 from interconnection reform alone. ⚠ modelled range; carry the span, never a midpoint
- scaffold · In-session arithmetic, 2026-08-29 — the 2.28× demand multiple; the four-to-five year turbine wait derived from the 2030–31 booking horizon; and the zero-to-six year saving from the turbine bypass. Internal calculation, not an external source
- scaffold · Our reading, 2026-08-29 — that renewable interconnection, data-centre energisation and inertia provision are three claimants on one manufacturing base, and that stability procurement therefore lengthens energisation lead times. ⚠ No source states this. Three inputs are unestablished — compensator manufacturing output, its concentration, and contracted post-Iberian volume — and §5 names all three. Carried as a mechanism to watch, not a finding to plan against
- scaffold · Gulf inertia exposure — ⚠ seeded from the equipment-queue exposure that HUMAIN's 6 GW / 42.0 TWh load shares with other operators; no source verifies a comparable inertia constraint on Gulf grids
Continue the thread
Get the next material change, not the next headline.
Receive new UFOQ briefings and concise signal updates when the evidence changes enough to matter.